POWWR’s summer expectations published in April 2025 are shown in Figure 1. We foresaw a warm west and a more normal eastern two-thirds of the nation, including ERCOT; with a cool Southeast. Due to the Federal government shutdown, the National Oceanic and Atmospheric Administration (NOAA) site we use for actuals is not updating with SEP data.
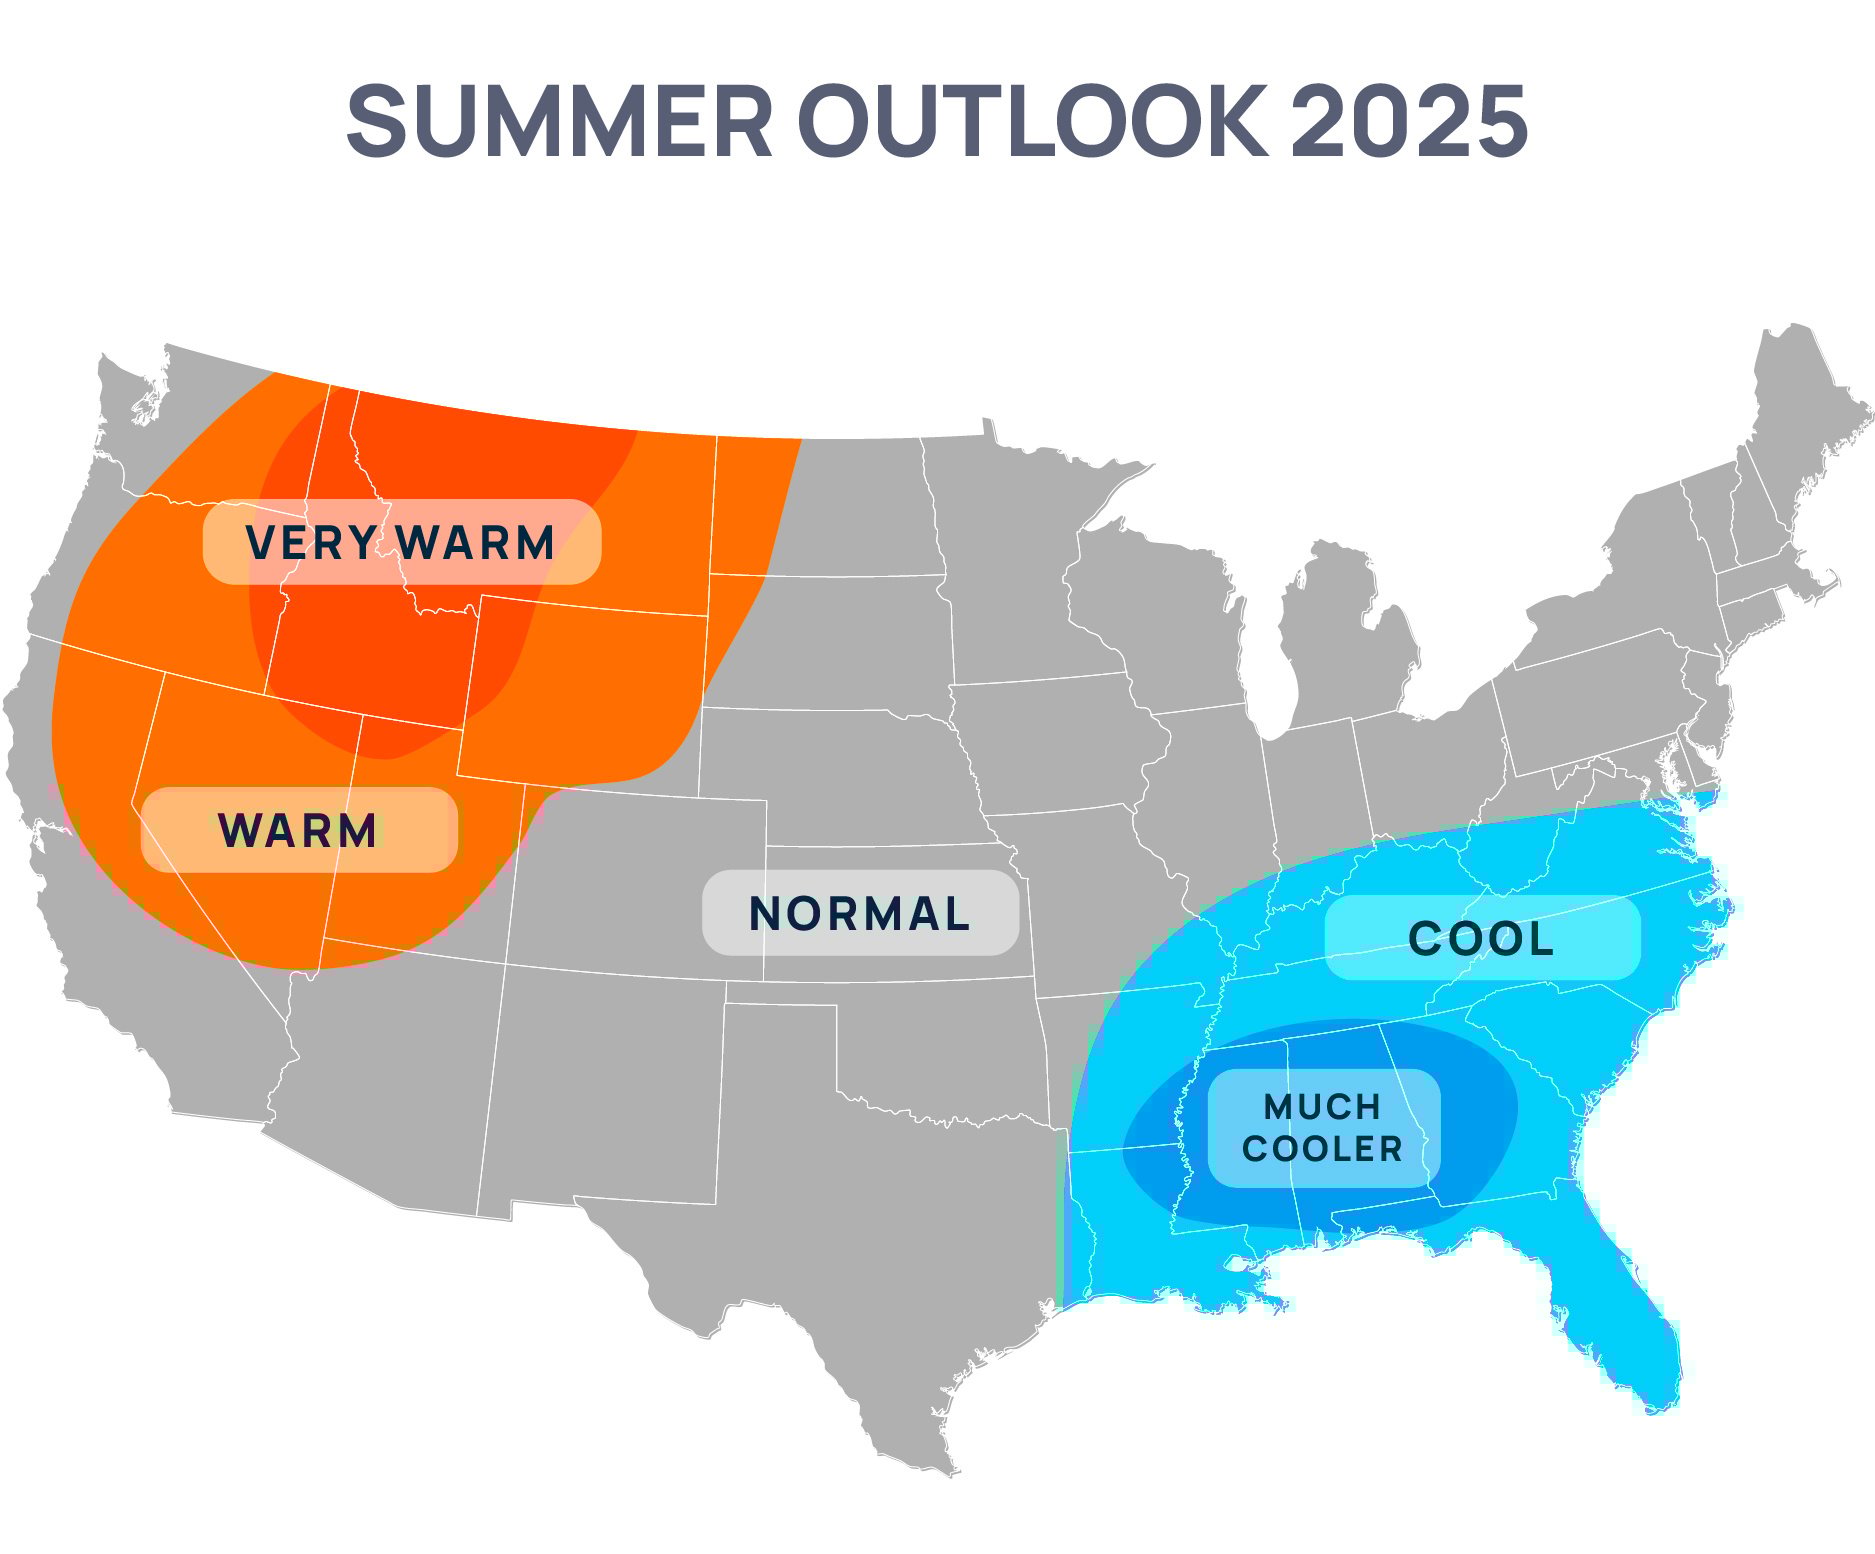
Figure 1
Therefore, we are forced to compare our MAY-SEP anomaly forecast with MAY-AUG anomaly results (Figure 2). This is not a perfect comparison but is the best that can be done given the circumstances. The “misses” of our forecast centered mainly on the East, where slightly warmer-than-normal conditions actualized instead of the normal and cool conditions for the Northeast and Southeast, respectively.
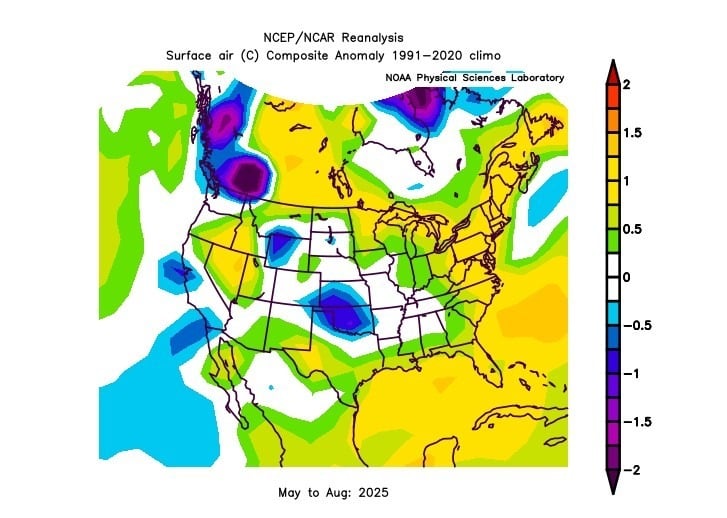
Figure 2
Winter 2025-26
The State of El Nino / La Nina
Climatologists refer to the state or condition of El Nino / La Nina by using the scientific term, the El Nino Southern Oscillation (ENSO). ENSO incorporates and describes the state of the atmospheric pressure and wind patterns and oceanic sea surface temperature pattern of the tropical Pacific Ocean. Currently, ENSO is in a neutral state. Recent climate models show it most likely to transition to a mild La Nina state during Fall then return to a neutral state through winter and even spring, Figure 3.

Figure 3
Current eastern tropical Pacific sea surface temperatures do show the typical La Nina-like cold anomaly pattern, Figure 4. The ENSO pattern is crucial to the winter outlook because it sets the overarching climate pattern which then dictates the predominant jet stream pattern in the Northern Hemisphere.
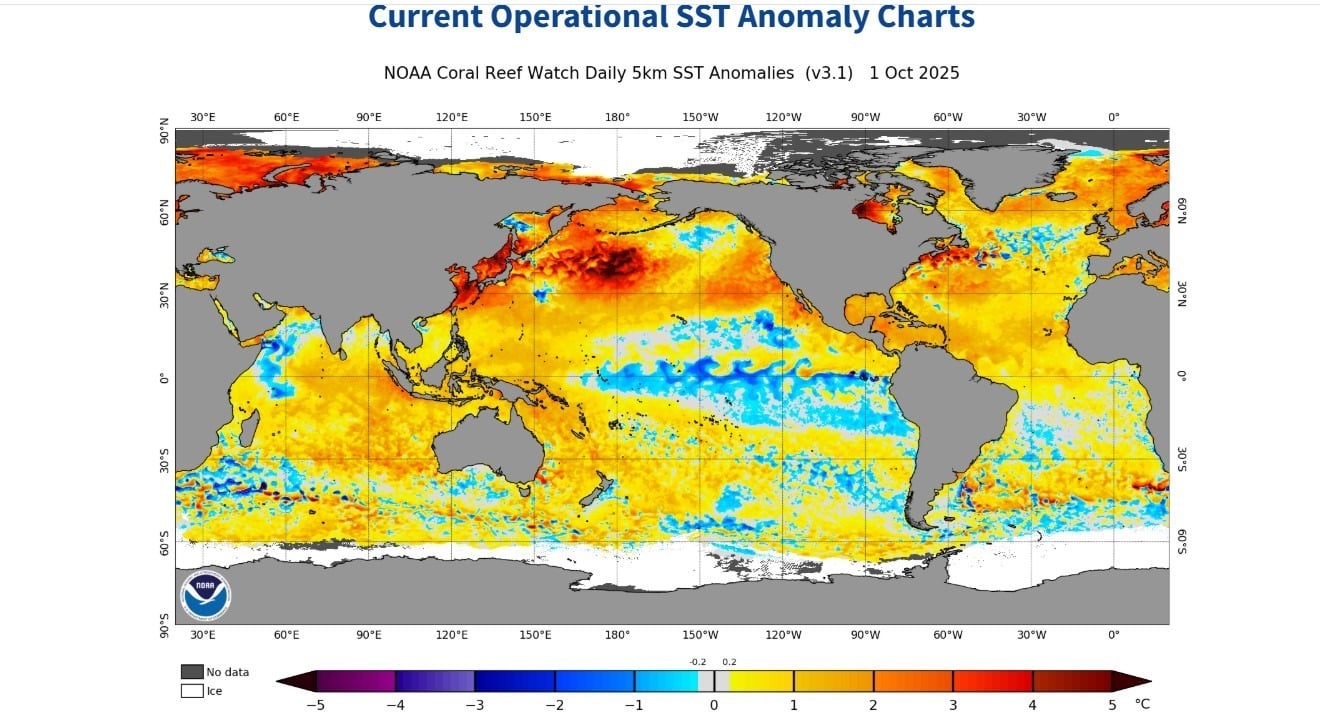
Figure 4
Arctic Sea Ice
There needs to be two items for a cold winter to occur in the United States…a pool of very cold air in the northern latitudes and a mechanism to transport that cold air southward. Physically, the cold pool is replenished via Arctic sea ice. In late August / early September, Arctic sea ice reached its minimum annual quantity, as is normal, see Figure 5.
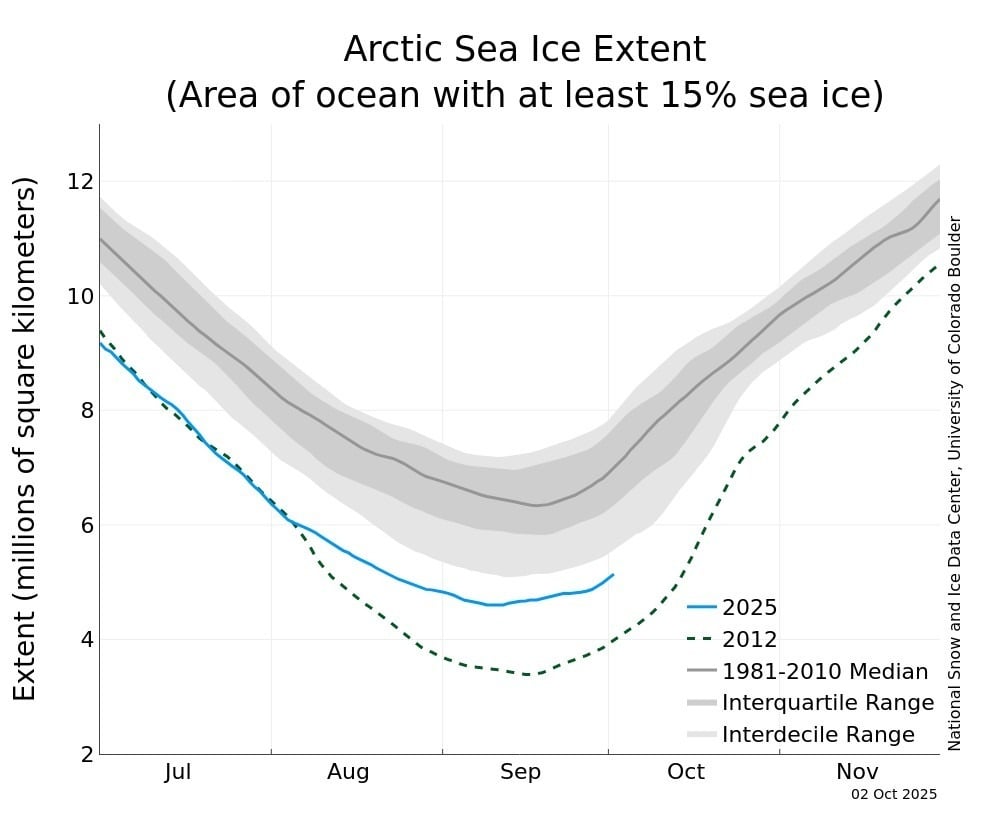
Figure 5
Currently, the coverage and total quantity of sea ice is in the early stages of rebuilding after the summer thaw. From the figure, one can see that while the annual minimum was one of the two most drastic minimums in the last 45 years, the rebuilding process should move it towards the interdecile range in the coming months, much like any of the recent winters.
The Polar Low
Think of the polar low as a region of low pressure spinning, rotating, and undulating near the North Pole. When an undulation either dips south or an undulation gets “pinched” and breaks off and drifts into the continental U.S. as a cut-off low, cold air is brought into the U.S. The first case potentially being an Arctic Blast, depending on factors and circumstances. This is the “mechanism of transport” described in the Arctic Sea Ice section. Since the winter of 2024-25, the polar low has been actively spinning and undulating, even during summer 2025. If you remember, there were quite a few occurrences this summer of mild, Canadian air dropping down (some even reaching Texas), bringing precipitation and some relief from the heat. Well, we believe this active spinning and undulating will continue, especially as we get into the heart of winter, JAN-FEB. Figure 6 shows the mean sea level pressure (MSLP) forecast of the mid-day Oct 3 update of the GFS (American) Model valid at time step 288 hours, October 15, 2025. One can easily see the large areal extent the polar low (in blue) is forecast to have, along with its numerous undulating lobes.
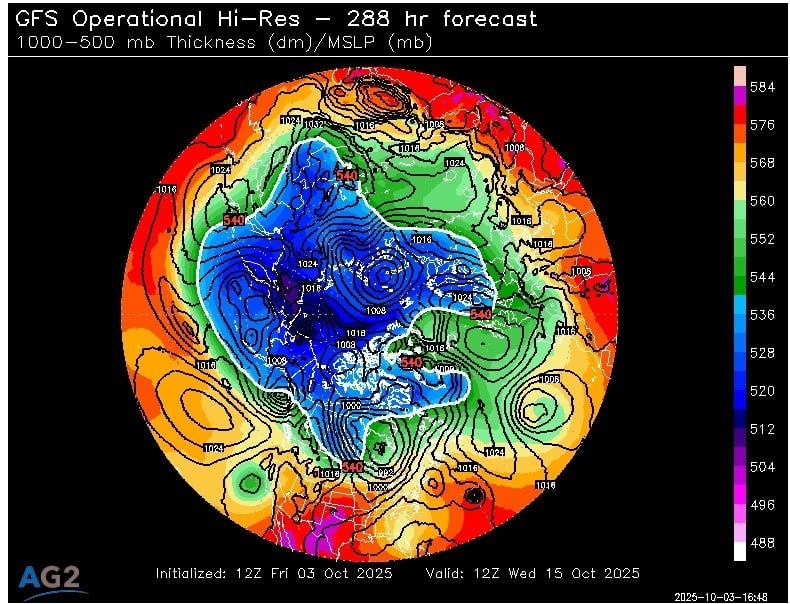
Figure 6
POWWR’s Winter Outlook
Given the above three inputs, early La Nina transitioning to Neutral, an expected typical amount of Arctic sea ice, and an active polar low, POWWR believes this NOV-MAR will be one where the cold anomalies will be centered west of the Rocky Mountains (Figure 7).
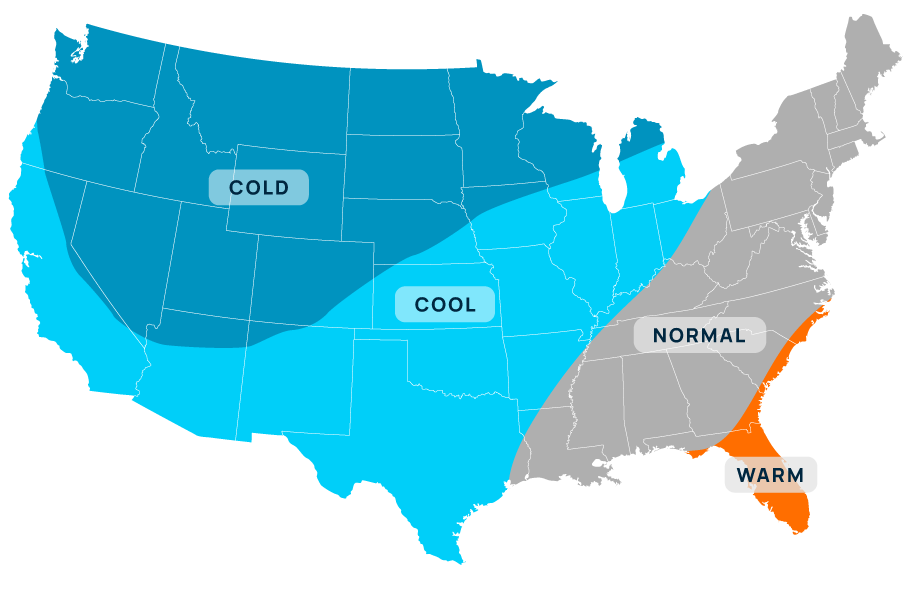
Figure 7
Additionally, POWWR forecasts cool conditions across the Plains, extending from Texas into the Ohio Valley. We believe normal conditions will be the case for much of the South into New England, with just the Southeast coast (peninsular Florida through coastal North Carolina) expected to experience warmer-than-normal conditions for the November through March period, in aggregate.
The above prognostication for November through March in aggregate does not imply that every day in the five-month period will be as stated above. That would be a very rare occurrence, an extreme outlier. The typical pattern for any winter is a series of cold air masses, either of Canadian or Arctic origin, which enter the United States, progress to the south and east, and either transition into the Atlantic or shift back north into Canada. Once the cold air leaves the continent, the air over the eastern two-thirds of the U.S. will moderate and warm to some extent until the next air mass from Canada comes through. In many ways, it is the intensity and longevity of the warming days which dictate the overall monthly anomaly during winter. For example, two or three weeks of intense warming will definitely eat into two or one weeks of moderate cold anomalies.
The POWWR Winter Outlook implies an overall entry point of the cold air that is west of the Rocky Mountains. If any of the entry points of what we think will be numerous cold air intrusions slide east closer to or just east of the Rockies, more of the central U.S. would feel the brunt of the cold, including ERCOT, MISO, and western PJM. This is the risk to our outlook, a more eastward entry point for the cold air than the Intermountain West, leading to colder conditions for a larger percentage of the population. Additionally, an upward parallel shift of the forward curves of both natural gas and electricity will occur if more numerous, eastward entry points actualize. This will increase the population-weighted heating degree days (HDDs) and will have a greater impact on total natural gas usage and therefore, storage, than a general entry point in the Intermountain West.

NOTE: POWWR provides this information as a courtesy to enhance the risk management process and are not responsible for the accuracy of this forecast and/or actions taken as a result of this forecast information.
 |
|
Mr. Palao specializes in commodity risk management and the science of meteorology/climatology. For the past 13 years, he has served as one of POWWR’s many subject matter experts. He has 25 years of experience in the energy/utility industry, where he uses his skills and knowledge of meteorology and advanced statistics.
From 2000 through 2011, he worked at TXU Energy Trading/Luminant Energy in Dallas where he served in three capacities. Most recently, he served as Capital/Liquidity Manager of the trading portfolio, optimizing the use of capital while still maintaining profitability. Prior to that, he managed the Weather Derivatives trading desk, devising strategies and executing trades for both speculative and hedging purposes. Upon joining TXU, he served as manager of the Quantitative Risk Group, assisting the company in the identification, quantification, and remediation of financial risks inherent in the company’s multi-commodity trading portfolio.
In his first foray into energy/utilities, he was a Marketing Executive with Louisiana Gas Service Company, a local distribution company, where he primarily marketed natural gas technology to commercial and industrial customers. Before that, he served as a Research Scientist under contract to the National Oceanic and Atmospheric Administration (NOAA).
Mr. Palao has an M.B.A. from Tulane University. He also has both an MS and BS in Meteorology from Florida State University. He is a member of the Financial Weather and Climate Risk Management Committee of the American Meteorological Society (AMS).

Share this

2023 Summer Outlook Report
2023 Winter Outlook